baha WebStation
The Real-Time Terminal for Investment Advisors, Traders, Analysts, and Fund Managers
Your easy access to information.
Top customers like major Banks, Central Banks, Asset Managers, Pension Funds and Other Leading Institutions!
Intuitive. Anywhere. Informed.
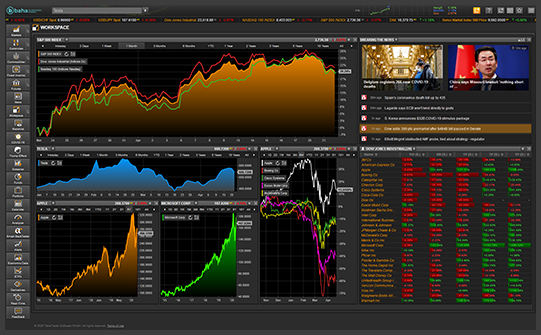
The baha WebStation is the information platform for the institutional user. The WebStation provides real-time prices and historical data along with news, charts and technical analysis. Due to the browser-based platform, the supply for large and distributed user groups can be established with ease. This is additionally supported by a permission system allowing the configuration of exchanges, news and other sources for groups and single users.
The Webstation experience
Web-based, modern institutional Real-Time Terminal
The terminal with an information advantage with real-time quotes, historical data, news and fundamental data, as well as charts and technical analysis.
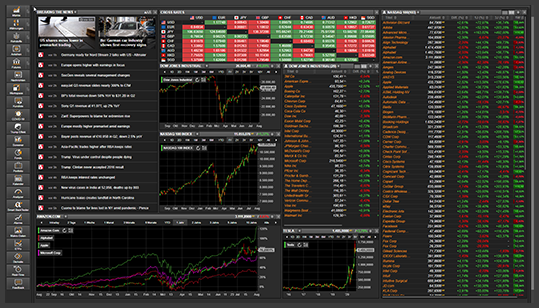
Intuitive and easy-to-use from day-1
Preconfigured workspaces make it easy to start and customized based on your individual requirements. With the help of the baha customer success team you will get an online webinar as introduction so that you can also benefit from the more advanced features.
Market Overview
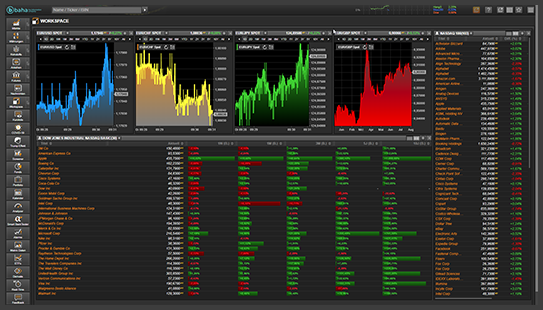
The baha WebStation features market overview pages, such as a general Market Overview, a Currencies Overview, the News section, the Economic Data calendar and many more. By clicking the name of a symbol, you can display its detail page. The Chart Overview can be customized with drag & drop.
New features every 4 weeks
The quick release cycle of the WebStation brings new killer features every 4 weeks. Every release brings new customer-requested features, customized for the specific business situation. User requests can be made on every page of the WebStation via a simple, easy feedback function.
24/7 breaking news
Integrated baha breaking news (link) are available in several places in the WebStation:
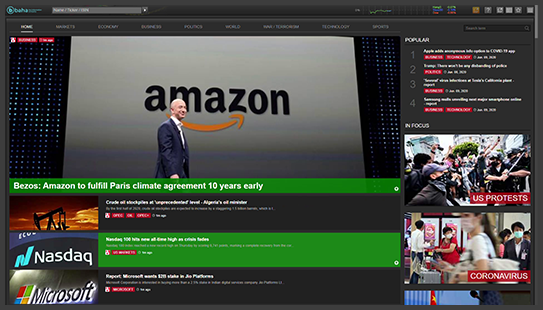
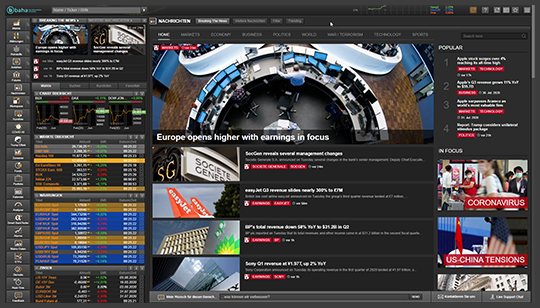
The News Overview lets you browse through all news stories and search/filter with specific criteria
The News section in the Overview pane shows the latest news headlines
All news stories can be downloaded, and you can configure the preferred news language and news packages
In all places of the WebStation, important news stories ("breaking news") are highlighted, and positive / negative market impact of a news story is highlighted in green / red.
The terminal with information advantage
Trending News
Analyzing the global media landscape, the current top stories are identified, helping you to prioritize and analyze what is important in the world right now.
Economic & Corporate Calendar
The Economic Calendar overview shows the most important macro-economic events for today and tomorrow, such as employment figures etc. The events are shown color-coded. Each event also has a detail page, including a short description of each figure and its historical development (incl. chart when relevant). The Corporate Calendar shows upcoming company-related events for the current week, next week and future events.

Interactive charts and technical analysis
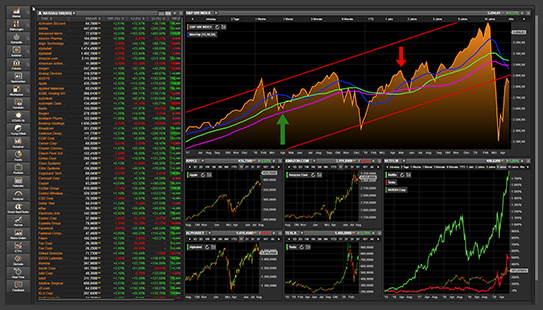
With the interactive HTML5 Chart you can follow the development of one or more symbols. Tick, intraday, daily, weekly and monthly charts. 5 different chart types: linear, logarithmic and percentage scale. Overlay of securities. Over 100 indicators. Drawing tools like lines, trend channels, text, Fibonacci retracements and many more. Preferred chart settings are saved automatically. Drag & drop any symbol onto a chart to have it overlaid on your chart!
Hot Stocks & Unusual Volumes
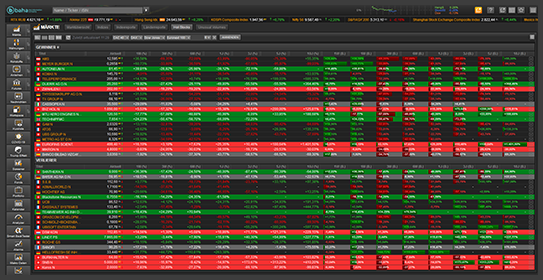
With Hot Stocks you can easily identify top gainers and losers of several selected indices combined. The Unusual Volumes page in the WebStation shows you a list of stocks from selected exchanges that are showing unusually high volumes in the current trading session.
Analyst Recommendations Analyzer
The Analyst Recommendations Analyzer overview shows the different Analyst Recommendations of the current and previous week with graphical overview of the prevailing trend of analyst recommendations. You can also search / filter for specific analyses.
Powerful features & power-tools
Virtual Portfolios
With the Portfolio function you can simulate various portfolios. You can define the starting capital, portfolio currency, fees, deposits, and withdrawals – all those settings are of course considered in the calculation of the portfolio. Securities / symbols can be added to your portfolio with drag & drop or with a symbol action and can be removed through a sales transaction.
Watchlists and Alerts
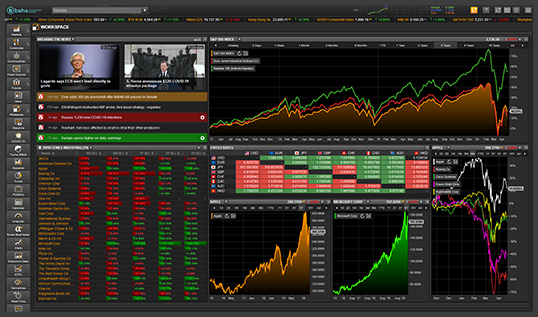
With watchlists, you can create your own set of symbols, get news and notifications for those symbols, and compare selected symbols with each other. You can also share selected watchlists with your colleagues.
Screener
The Screener function of the TeleTrader WebStation assists you in picking the most promising securities out of thousands from the world's major stock exchanges. It enables you to filter for market data, fundamentals and technical indicators in real time. Screens can be easily created, executed, and stored for later use. Screener notifications per e-mail inform you regularly about new results of your saved screens.
Bond Calculator
The Bond Calculator calculates several key figures based on specific settings. You can either choose all settings yourself or take over certain relevant settings from a specific bond. As to the result calculated, you can either set a fixed clean price and calculate the yield to maturity or set a fixed yield to maturity and calculate the clean price.
AI Trader
With the AI Trader function of the WebStation, you can find an optimized trading system with the help of Machine Learning. Since it is difficult to optimize a trading system manually or to find the proper indicators, combinations and parameters, Machine Learning methods are utilized to assist you in this task.
Smart Backtester
The Smart Backtester function of the WebStation lets you simulate a virtual brokerage account in terms of cash, currency and leverage, implementing your chosen trading strategies for entry and exit of a position, and check the profitability of your trading strategies with real historical data. Strategies can be based on technical indicators such as Moving Averages, MACD, Fibonacci Retracements, Pivot Points, Candlestick patterns and many others. Asset classNamees that are supported as testing materials are stocks, ETFs, funds and futures.
Mountain-View Funds Ratings
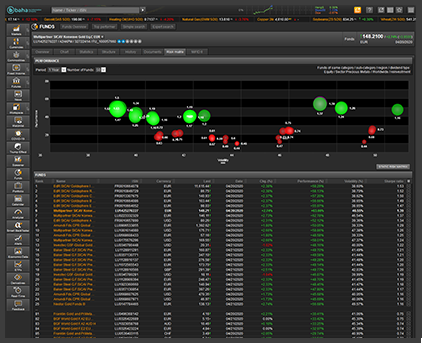
The Mountain-View Funds Rating focuses on which funds will be able to generate the highest returns. A strong focus on future returns differentiates the Mountain-View Funds Rating from conventional funds ratings. On the detail pages for most funds, in search results and on the Statistics page for funds, the Mountain-View Rating is displayed. The Mountain-View Funds Rating provides a clear and comfortable comparison between the aspects preservation of value, performance and risk. The top 10 per cent of each investment funds category receive the highest score. The Mountain-View Funds Rating is unique in offering investors the opportunity to evaluate investment funds with regards to ethical, social and environmental criteria and content. The Mountain-View Funds Rating enables investors to find easily those funds matching their individual preferences so closely as if they were a bespoke investment solution.

Easy to deploy, & power-tools
Enthusiastic support
Local, responsive support with a dedicated onboarding seminar (online or onsite) to get new users started quickly. The support team is there to answer any question you might have with the use of the WebStation, the global real-time data, available optional packages, request new features, or any other questions you might have.
Real-Time Data in Excel (RTD)
You can display live, updating quote data or historical data in Microsoft Excel using the software TeleTrader RTD Server. RTD (Real-Time Data) is a technology that was specifically designed for live data scenarios. It uses the built-in RTD formulas of Microsoft Excel, which means that you can use cell references etc. as placeholders in your spreadsheets like with any other Excel formula.
Easy to deploy in corporate or home-office environment
Deploying the WebStation is a simple process to roll out across the business. Every time there is an upgrade this is applied centrally through the baha cloud without the need to upgrade each machine. This means that new software or upgrades are implemented more easily, and maintenance can be carried out through a central point.
Operating in dedicated baha cloud
You are always in full control of your data. Operated on a worldwide infrastructure with multiple datacenters in New York, London, Frankfurt and Vienna.
Work anywhere: Web-based & platform-independent (Win/Mac)
Compared to desktop applications, web-based applications provide a whole range of business advantages. These applications can be accessed from any computer through the internet, instead of having to be individually installed on each computer that you wish to access it from.
Dedicated dashboards
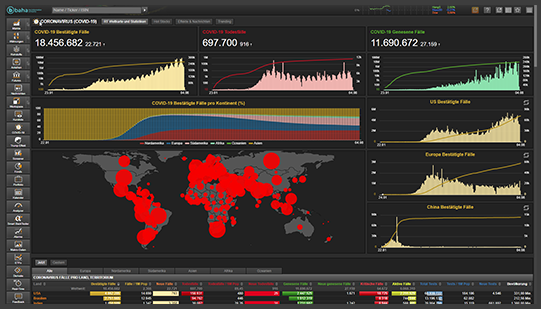
Dedicated sections for major global developments that impact the markets, for example the current COVID-19 Dashboard with global real-time situation overview, international data, effects and news, and trending stories.
